Understanding Wind Propulsion: Key Concepts and Terms
As discussed in our previous articles, regulatory pressure, advances in wind technology including cost acquisition reduction and rising fuel costs are driving the adoption of Wind-Assisted Ship Propulsion (WASP) technologies as a key decarbonization pathway. However, as the number of systems and stakeholders increases, so does the complexity of the language used.
Today, different actors such as naval architects, regulators, shipowners and technology providers, often use different terms to describe the same concepts, or the same terms with different meanings. This lack of standardization leads to confusion, hinders fair comparisons, and slows down investment decisions.
Organizations like IMO, ITTC, and IWSA have made significant progress in developing common definitions and technical guidelines (e.g., IMO Circ.896, ITTC Recommended Procedures 2024, IWSA White Paper). This article builds on those efforts to introduce key concepts and vocabulary, helping readers navigate the language of today’s wind propulsion landscape.
Fundamentals of Wind Propulsion
How Wind Propulsion Systems Work: From Aerodynamic Coefficients to Ship Polars
At the core of wind propulsion lies a simple physical principle: when air flows around a surface, a pressure difference is generated, creating an aerodynamic force. This force can be decomposed into lift (perpendicular to the flow) and drag (parallel to the flow). By properly orienting and trimming wind propulsion devices, the lift vector can be directed to produce thrust in the vessel’s direction of travel (driving force), thereby reducing the load on the main engine.
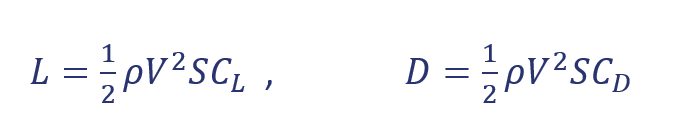
In traditional sailing, sails are adjusted to exploit the incoming wind, generating forward thrust. Modern Wind-Assisted Ship Propulsion (WASP) devices rely on the same aerodynamic fundamentals but use engineered geometries: rigid wings, flettner rotors, suction sails or kites that are optimized for performance, durability, and integration with large commercial vessels. The fundamental aerodynamic relationship is:
where L is the lift force, D is the drag force, ρ is air density, V is the relative wind speed and S is the device’s projected surface area. CL is the lift coefficient and CD is the drag coefficient of the selected device, and each WASP device will offer different aerodynamic coefficients depending on its geometry and operating conditions.
To integrate these forces into ship performance, the thrust (CT) and side or heeling force (CH) coefficients are used, linking the aerodynamic forces to the vessel’s hydrodynamics. The ship must balance these forces through leeway, heel, and rudder (plus additional appendages) action to maintain course. This interaction explains why installation layout, position relative to superstructure, and multi-device interference are critical in performance prediction.
Balance of Aerodynamic and Hydrodynamic forces on a ship. Image taken from navegantesoceanicos.com
Finally, performance is often summarized using polar diagrams, circular plots showing thrust, power, or savings across true wind speeds and angles. These diagrams illustrate how different device types behave under varying conditions and are fundamental inputs for route simulations and operational performance assessments.
Traditionally, sailing performance has been represented through CL — CDpolars, which plot the lift coefficient (CL) against the drag coefficient (CD) for different angles of attack. These curves illustrate how efficiently a device converts wind energy into useful lift across a range of aerodynamic settings.
Lift-Drag polar and decomposition of lift and drag into driving force and side force. Image taken from Joop Slooff, “ The science behind sailing”
On a CL — CDpolar plot, each point on the curve corresponds to a specific angle of attack, and the straight line drawn from the origin to that point represents the total aerodynamic force vectorFA for that setting. The angle β represents the apparent wind angle.
For a given apparent wind angle, the maximum propulsive force can be found graphically. This is done by drawing a line with a direction perpendicular to the vessel’s course and shifting it until it becomes tangent to the polar curve. The point of tangency represents the optimal sail or device trim for that wind angle, the condition where the driving force (aligned with the ship’s course) is maximized. Decomposing the total aerodynamic force at this point gives two components: the driving force (T), which contributes to propulsion, and the side force (SA) which causes heeling and must be balanced by the vessel’s hydrodynamics.
This is the fundamental aerodynamic “potential” of the device, independent of ship dynamics, and each wind propulsion device has its own polar shape depending on its aerodynamic characteristics. However, ships operate within complex hydrodynamic environments. So, once aerodynamic forces are computed, they are embedded into Velocity Prediction Programs (VPPs) that solve the force equilibrium between wind propulsion devices and the vessel’s hydrodynamics across a range of Apparent Wind Angles (AWA) and speeds.
The result is a ship polar diagram, a circular plot that shows thrust, power, or fuel savings at different True Wind Angles (TWA) and wind speeds for a given ship speed. VPP programs not only solve for the force equilibrium, but also optimize the overall performance of the ship, so each point on a ship polar diagram considers the best trimming condition for the aerodynamic devices.
Example of power savings [%] vs TWA, for different TWS at 12 knots of boat speed. (Image adapted from internal work)Unlike CL — CDpolars, which depict theoretical device efficiency, ship polars reveal operational performance: the real contribution of wind propulsion to the vessel under different sailing conditions. However, this optimized performance still represents potential gains. Until route calculations are not involved and real sailing conditions are considered, we cannot talk about total power or fuel savings. For example, a device may display high aerodynamic efficiency in isolation but contribute little to thrust on certain routes if it performs poorly at low AWAs (dead upwind conditions).
Main Types of Wind Propulsion Systems
Modern Wind-Assisted Ship Propulsion (WASP) technologies are based on the same aerodynamic principles but differ widely in geometry, control systems, and integration complexity. They can be broadly grouped into six main categories: soft sails, hard sails or wingsails, Flettner rotors, suction wings, kites, and hull form adaptations.
Each system generates thrust through the interaction of lift and drag forces, but the way these forces are produced and controlled defines their efficiency, power demand, and operational use. At the end, each technology presents distinct trade-offs in terms of aerodynamic efficiency, control complexity, and integration feasibility. The choice of system ultimately depends on vessel type, operational profile, and desired balance between capital investment, energy savings, and regulatory compliance.
It is important to note that the CL and CDvalues presented here are indicative and serve only as references to illustrate the aerodynamic potential and behavior of each device type. Actual coefficients depend strongly on each system’s geometry, control strategy, and trim configuration, meaning that accurate performance estimation requires device-specific analysis under representative operating conditions.
Soft Sails represent the most traditional form of wind propulsion. They consist of flexible fabric surfaces supported by masts, booms, and rigging, which are trimmed to achieve the desired shape and angle to the wind. Acting as cambered airfoils, they generate lift perpendicular to the apparent wind, creating forward thrust while producing a smaller side force.
Their aerodynamic efficiency depends on sail tension and form stability, with typical lift coefficients (CL) between 1.0 and 1.5, and drag coefficients (CD) between 0.05 and 0.2. Although they require little to no electrical power, only limited energy for trimming.
New materials and production techniques are increasing the soft sails categories. Now these sails come in a wide variety of configurations and shapes, like the dynarig system, hybrid designs using furlable rigid panels or inflatable sail systems. The sizes for these types of sails vary considerably and will depend on stability and maximum heeling moment factors.
Hard Sails or Wingsails build upon the same aerodynamic concept but employ rigid, airfoil-shaped profiles similar to aircraft wings. Often designed as single or multi-element configurations, they can rotate, reef, or fold for operational safety and port access. Their rigidity allows for precise control of lift and drag, with CL values reaching 2.5–3.5, delivering lift-to-drag ratios (L/D) above 20 under optimal conditions.
The resulting high aerodynamic efficiency enables strong upwind capability and steady performance across a wide range of wind angles. Power needs are minimal, typically a few kilowatts per unit, limited to automatic control and positioning systems. Commercial sizes vary from ~9 m to 40 m in height, depending on vessel size and route.
Flettner Rotors operate on a completely different aerodynamic principle, the Magnus effect. Each rotor is a tall, rotating cylinder that, when spun by an electric motor, interacts with crosswinds to produce a large pressure differential. The resulting lift force acts perpendicular to the apparent wind, delivering significant thrust when the wind is abeam (around 90° AWA).
Flettner rotors can achieve remarkably high lift coefficients (CL= 5–10) with moderate drag (CD ≈ 3–4) at high spin ratio values. Instead of angle of attack, the main parameter affecting aerodynamic efficiency is the spin ratio, the ratio of cylinder surface speed to wind speed. Aspect ratio (height/diameter) and end-plate ratio are also critical parameters in maximizing efficiency, and some manufacturers offer hydraulic tilting or folding mechanisms that allow the rotor to lie horizontally during cargo handling or under bridges.
They require continuous electric power, typically between 40 and 115 kW per rotor at maximum RPM, but their net energy gain far exceeds consumption under favorable conditions. Commercial sizes vary from ~18 to 35 m in height and 3 to 5 m in diameter.
Suction Wings (or suction sails) take a hybrid approach between passive and active aerodynamic devices. They resemble thick, fixed airfoils equipped with internal fans that draw air through perforations in the surface, maintaining attached flow and delaying stall.
This active boundary-layer control allows for much higher lift at large angles of attack, with CL values up to 6–8 and CD values between 1.5 and 3, at same operational conditions. Their performance will depend on the ventilation power (or suction coefficient), the effectiveness of boundary layer suction and the angle of attack.
Power consumption remains moderate (typically below 15 kW per unit), making them an attractive option for vessels seeking a balance between efficiency and simplicity. Commercial sizes vary from ~12 m to 36 m in height.
Kites represent a different philosophy altogether, using high-altitude winds to tow the vessel from the bow. Modern towing kites are large parafoils launched and controlled by automated pods that optimize flight paths, often flying figure-eight patterns to maximize apparent wind speed. This dynamic motion amplifies lift forces, resulting in significant thrust with minimal onboard power demand.
The CLmax at useful operating AoA for modern towing kites lies between 1.0 –1.5. The associated CD at those “best glide / best tow” points fall roughly 0.2–0.3, yielding L/D ~3–7 for contemporary systems. Kites are particularly effective on ocean routes with consistent wind conditions, offering strong performance in downwind conditions without adding drag to the vessel structure when retracted. Sizes can vary depending on many factors, ranging from 500 to 1000 m2.
Finally, Hull Form Adaptations exploit the geometry of the vessel itself to enhance aerodynamic or hydrodynamic efficiency. Some designs integrate vented decks, lifting surfaces, or air-lubrication systems to produce additional thrust or reduce resistance. While their direct contribution to propulsion is small (CL < 1.0), they can provide meaningful energy savings when combined with other WASP technologies. These systems are normally passive, requiring no external power.
Main types of commercial wind propulsion devices
Glossary of Key Terms and Concepts
With the fundamentals established; to help navigate this technical and regulatory landscape, we’ve compiled a glossary of essential terms used across the wind propulsion industry. The terms are grouped by theme. (All definitions adapted from IMO, ITTC, IWSA White Paper, Wind Propulsion Principles and internal work).
Ship Performance
Appendages: Small parts that project from the main hull, such as the rudder, propeller shafts, struts, bilge keels, and stabilizers, which are crucial for control, stability, and propulsion.
Superstructure: The part of the vessel that extends above the main deck, containing vital areas like the bridge, crew and passenger accommodations, and operational spaces.
Heel (or roll) angle: The angle of tilt or inclination of a vessel compared to its vertical neutral equilibrium state, expressed in degrees.
Leeway angle: The angle a boat drifts off course to leeward due to the sideways force of the wind.
Yaw angle: Same angle but with opposite sign to the leeway angle
Pitch angle: The angle of a boat’s bow and stern, with respect to its horizontal reference line, as it moves up and down (pitch motion)
Surge: It is the motion along the longitudinal X-axis
Sway: It is the linear motion along the transverse Y-axis
Heave: It is the linear motion along the vertical Z-axis
Sinkage: It is the increase in the draft of a vessel due to loading or forward movement.
Coordinate system used for ship motion. Image taken from Roy de Winter “Designing Ships using Constrained Multi-Objective Efficient Global Optimization”
Sail trim: Refers to the adjustments made to a sailboat or sailing vessel’s sails to optimize their shape and position relative to the wind.
Point of sail: It is a sailing boat’s direction of travel under sail in relation to the true wind direction over the surface
Into the Wind (A): The wind comes directly opposite to the direction of sailing (no-go zone)
Close-Hauled (B): Sailing at the sharpest angle possible toward the wind without entering the no-go zone, where sailing isn’t possible.
Close-reach (B-C): Between close-hauled and a beam reach.
Beam-reach (C): The boat has the true wind at a right angle to its direction (on its beam).
Broad-reach (D): The true wind is coming from behind, but not directly behind.
Running Downwind (E): The wind coming from directly behind the boat.
Points of sail. Image taken from Wikipedia
Boat Speed (BS): Boat’s navigation speed, usually expressed in knots. This term could be divided into Speed over ground (SOG), which is the boat’s actual speed relative to the Earth’s surface and Speed Through Water (STW), which measures the vessel’s velocity relative to the water around it.
True Wind Angle (TWA): Meteorological wind direction relative to vessel heading, expressed in degrees.
True Wind Speed (TWS) : Meteorological wind speed relative to vessel heading, expressed in knots.
Apparent Wind speed (AWS): Wind velocity experienced onboard, combining true wind conditions and vessel motion, expressed in knots.
Apparent Wind angle (AWA): The angle of incidence of the relative wind experienced onboard, combining true wind conditions and vessel motion, expressed in degrees.
Difference between True Wind and Apparent wind direction. Image taken from Konstantinos M. “ Wind Propulsion Principles”
Polar diagram: It is a diagram that provides thrust or power contributions at various wind speeds and angles, at a given boat speed.
Upwind capability: The ability of a system to generate thrust at low apparent wind angles. Systems with higher upwind capability offer more consistent performance across routes, as they can contribute to a wider range of wind conditions.
Surrogate Models: Simplified and computationally faster to evaluate models that approximate the behavior of more complex processes, coming from CFD or experimental data.
Response Surface: It is a graphical representation of the relationship between one or more response variables and a set of factors or independent variables.
Velocity Prediction Program (VPP): Optimization tool that solves vessel equilibrium under various sailing conditions to generate polars.
Primary Wind Propulsion: When wind acts as the main energy source for moving a ship, often supplemented by a smaller supporting engine (>50% of propulsion).
Wind-Assist Propulsion: When wind acts as a complementary source of energy to move a ship (<50% of propulsion).
Wind-Ready: Vessels prepared for supporting wind propulsion systems, under structural and stability requirements.
Characteristics of Wind-Assist and Primary Wind vessels. Image taken from “IWSA White paper”
Aerodynamics Principles
Angle of attack (AoA): The angle between the chord line of a wing or a sail and the apparent wind angle.
Spin Ratio: For Flettner rotors, the ratio between the rotor’s tangential speed and the apparent wind speed, directly affecting lift generation.
Suction Coefficient (Cq): Dimensionless measure of boundary-layer suction intensity in suction sails, relating fan flow rate to freestream conditions.
Reynolds Number (Re): Dimensionless quantity expressing the ratio between inertial and viscous forces in a fluid, influencing aerodynamic performance and flow regime.
Endplate Ratio: Ratio between the diameter of rotor endplates and rotor diameter, affecting efficiency by controlling tip vortices.
Aspect Ratio: Ratio between span (height) and chord (width) of a lifting surface, with higher ratios typically increasing lift-to-drag efficiency.
Induced Drag: Component of drag caused by lift generation. It is a direct result of wingtip vortices created by the difference in pressure between the top and bottom of the wing.
Boundary layer: The thin layer of fluid near a surface where the fluid’s velocity changes due to the surface’s friction
Lift Force (L): The force acting perpendicularly to the direction of the wind flow, expressed in Newtons.
Lift Coefficient (CL): A dimensionless quantity that relates the lift generated to the fluid density, the fluid velocity and an associated reference area.
Drag Force (D): The force acting longitudinally in the opposite direction to the wind flow, expressed in Newtons.
Drag Coefficient (CD): A dimensionless quantity that relates the drag generated to the fluid density, the fluid velocity and an associated reference area.
Aerodynamic Efficiency (L/D ratio): Is a measure of an object’s aerodynamic efficiency, representing the amount of lift it generates for a given amount of drag.
Center of pressure: Is the point on a surface where the total sum of pressure forces is concentrated, acting as a single point for the total force and moment on an object
Explanation of the Angle of Attack, Lift and Drag. Image taken from Konstantinos M. “ Wind Propulsion Principles”
Thrust Force (T): The total resultant force exerted on the ship in the forward direction, expressed in Newtons.
Side or Heeling Force (H): The total resultant lateral force exerted on the ship relative to the advance direction, expressed in Newtons.
Magnus effect: The force exerted on spinning cylinder or sphere moving through air, or another fluid, in a direction at an angle to the axis of spin.
Energy, Emissions & Operations
Well-to-Tank (WTT): Emissions from fuel production and delivery to ship’s tank.
Tank-to-Wake (TTW): Emissions from fuel use onboard for propulsion and auxiliary systems.
Well-to-Wake (WTW): Full lifecycle emissions from production to use.
LCA (Life Cycle Assessment): Evaluation of total environmental impact from energy source production to use.
Attained Greenhouse Gas (GHG) Fuel Intensity (GFI): IMO metric that measures a ship’s annual average life cycle GHG emissions per unit of energy used, calculated as gCO₂eq/MJ
ROI (Return on Investment): Economic evaluation metric used to assess the profitability of an investment by comparing its net profit to its cost. Commonly used for retrofit or newbuild investment decisions.
Retrofit: Installation of WASP systems on an existing vessel rather than a newbuild.
Weather Routing: Voyage optimization considering wind, waves, and currents.
Dijkstra Algorithm: Graph-based method often used in route optimizations tools.
Green Corridors: Specific maritime trade routes targeted for zero-emission operations using technologies like sustainable fuels and wind-assisted propulsion.
Sea state: It is the general condition of the free surface of the sea with respect to the waves generated by the local wind and swell at a given place and time.
Beaufort scale: It is an empirical measure for describing wind intensity at 10m based on observed sea conditions.
Added Resistance in Waves (RAW): Increase in hydrodynamic resistance caused by wave motion, important in route-level performance modelling
Autonomous Control System: Automated onboard system that adjusts WASP devices for optimal performance and safety.
Feathering Mode: Configuration of a sail (rigid or soft) device to minimize drag when not in operation.
Foldable / Tilting Mechanism: Structural design feature allowing sails or rotors to fold for safety or port access
Regulatory and Policy
IMO (International Maritime Organization): The United Nations specialized agency responsible for maritime safety and environmental protection.
ITTC (The International Towing Tank Conference): A voluntary association of worldwide organizations that have the responsibility for the prediction of the hydrodynamic performance of ships and marine installations based on the results of physical and numerical experiments.
CII (Carbon Intensity Indicator): IMO metric that rates a ship’s operational efficiency by measuring CO₂ emissions per transport work.
Energy Efficiency Design Index (EEDI): IMO metric quantifying the design efficiency of new ships.
Energy Efficiency Existing Ship Index (EEXI): IMO metric assessing technical efficiency of existing ships.
Cap-and-Trade System: Market mechanism allowing the trading of emission allowances under schemes such as the EU ETS.
Carbon Intensity Trajectory: Targeted annual reduction pathway for a ship’s CII rating under IMO regulations.
Fit for 55: The EU’s legislative package aiming to cut greenhouse gas emissions by 55% by 2030, including measures that affect shipping such as the extension of the EU ETS and stricter fuel and efficiency rules.
EU ETS (European Union Emissions Trading System): The EU’s cap-and-trade system for reducing greenhouse gas emissions. Requiring ship operators calling at EU ports to monitor, report, and pay for their CO₂ emissions.
FuelEU Maritime: An EU regulation that sets limits on the GHG intensity of energy used by ships, starting in 2025. It encourages cleaner fuels and technologies through a penalty-and-credit system.
Common Misunderstandings
“High CL = High Savings”: A high wind propulsion device lift coefficient doesn’t guarantee large fuel savings; hull effects, routing, and operations strongly affect results.
“Polars = Savings”: Polars show potential, but routing and environmental factors determine real performance.
“Wind is too intermittent to be reliable” – With modern forecasting and routing tools, wind availability is predictable on most major trade routes.
“More devices = linear savings”: Interference and shielding effects often reduce the efficiency of the isolated devices, so doubling devices rarely doubles savings.
“WASP systems require extra crew”: Today’s commercial WASP systems are largely automated, turnkey solutions. Modern implementations integrate with navigation and control systems to minimize crew workload.
“Wind propulsion is too expensive with long ROI”: While initial capital costs can be high, rising fuel and carbon prices, regulatory incentives, and improved system efficiency often shorten payback times dramatically. Costs are also declining as more installations occur.
Conclusion
As wind propulsion enters mainstream shipping, a shared vocabulary is becoming a necessity. Clear, consistent terminology enables fair comparisons, supports regulatory alignment, and accelerates market adoption. This article has introduced the core aerodynamic principles, main system types, and key terms used across the sector, drawing from IMO, ITTC, and IWSA definitions.
These concepts underpin the technical, regulatory, and business conversations shaping the future of wind propulsion. As the industry advances toward 2030, 2040, and 2050 decarbonization checkpoints, alignment in language will be as vital as alignment in strategy. Only through common understanding can we ensure that technical innovation, regulatory recognition, and market adoption move in the same direction, with the wind.
References
IMO. MEPC.1/Circ.896. Guidance on treatment of innovative energy efficiency technologies for calculation and verification of the attained EEDI and EEXI.
ITTC. Report of the Wind Powered and Wind Assisted Ships Committee (2024).
IWSA et al. White Paper on Wind Propulsion (MEPC 81/INF.39, 2024).
Rigid sails aerodynamic coefficients: Hillenbrand, Antonia, Giovannetti, Laura Marimon, Dhomé, Ulysse , and Jakob Kuttenkeuler. «Wind Tunnel Tests of a Two-Element Wingsail with Focus on Near-Stall Aerodynamics»
Flettner Rotor aerodynamic coefficients: G. Bordogna, S. Muggiasca, S. Giappino, M. Belloli, J.A. Keuning, R.H.M. Huijsmans, A.P. van ’t Veer, ”Experiments on a Flettner rotor at critical and supercritical Reynolds numbers”
Suction Wing aerodynamic coefficients: A Llopis Pascual, G Bailardi, B Charrier and D Ferrer Desclaux, “Aerodynamic optimization of the esail, bound4blue’s suction sail for wind-assisted vessel propulsion”
Kite aerodynamic coefficients: Wang, Y.; Yang, C. “Simulation and Analysis of Aerodynamic Characteristics during Parafoil Canopy Curving Process and Application by LBM”
To provide the best experiences, we use technologies like cookies to store and/or access device information. Consenting to these technologies will allow us to process data such as browsing behavior or unique IDs on this site. Not consenting or withdrawing consent, may adversely affect certain features and functions.
Functional
Siempre activo
The technical storage or access is strictly necessary for the legitimate purpose of enabling the use of a specific service explicitly requested by the subscriber or user, or for the sole purpose of carrying out the transmission of a communication over an electronic communications network.
Preferences
The technical storage or access is necessary for the legitimate purpose of storing preferences that are not requested by the subscriber or user.
Statistics
The technical storage or access that is used exclusively for statistical purposes.The technical storage or access that is used exclusively for anonymous statistical purposes. Without a subpoena, voluntary compliance on the part of your Internet Service Provider, or additional records from a third party, information stored or retrieved for this purpose alone cannot usually be used to identify you.
Marketing
The technical storage or access is required to create user profiles to send advertising, or to track the user on a website or across several websites for similar marketing purposes.
Hydrodynamic workstreams supporting the BMW Oracle wing sail era (AC33)
During the 33rd America’s Cup cycle, Mario Caponnetto contributed to hydrodynamic assessment workstreams aligned with the BMW Oracle wing-sail platform, the configuration that ultimately won the Match. This milestone marked the shift toward aero-hydrodynamic integration in Cup design culture.
Partners:
BMW Oracle Racing
Project Type:
America’s Cup / Aero-Hydro Integration / Performance Engineering
In 2021, Caponnetto Hueber led the CFD, foil design, and hydrodynamic engineering for the AC75 of Luna Rossa Challenge, the eventual Prada Cup winner. We deployed multiscale CFD and aero-hydro coupling to ensure optimum lift and control. Rapid iteration delivered performance gains under tight competition timelines.